Top 5 KPIs your Safety Incident Tracking Software should be Monitoring
A safety incident tracking software monitors work-related illnesses and injuries in an organization. By recording and monitoring the incidents on multiple levels, the incident tracking software helps safety managers in getting to the root cause of these incidents. As a result, organizations can prevent such incidents and avoid incurring losses in the future. However, tracking a workplace safety incident is a complex task. Every safety incident tracking software needs to monitor incidents on multiple parameters, and these parameters are commonly known as key performance indicators (KPIs).
A Key Performance Indicator is a parameter that has a specific measurable value. This value determines the success or the failure of a process. Therefore, a specific set of KPIs are used to track incidents in workplaces. And, a safety management system software like Preverly ensures that all the important KPIs are used for tracking incidents.
The Preverly incident tracking software helps in using dozens of KPIs for monitoring and evaluating incidents. It provides an effective KPI tracking system that prioritizes the KPIs that have the most impact in improving workplace safety of the organization. In this blog, we discuss the five essential KPIs that every safety incident tracking software should monitor to protect the Environmental Health and Safety (EHS) of an organization.
This blog covers:
Preverly Incident Tracking Software – 5 Key Performance Indicators
An incident tracking software that monitors incidents and helps in achieving the desired safety KPIs can be used to implement the latest EHS protocols in an organization successfully. The following five KPIs are very important for making the right decisions on workplace safety management.
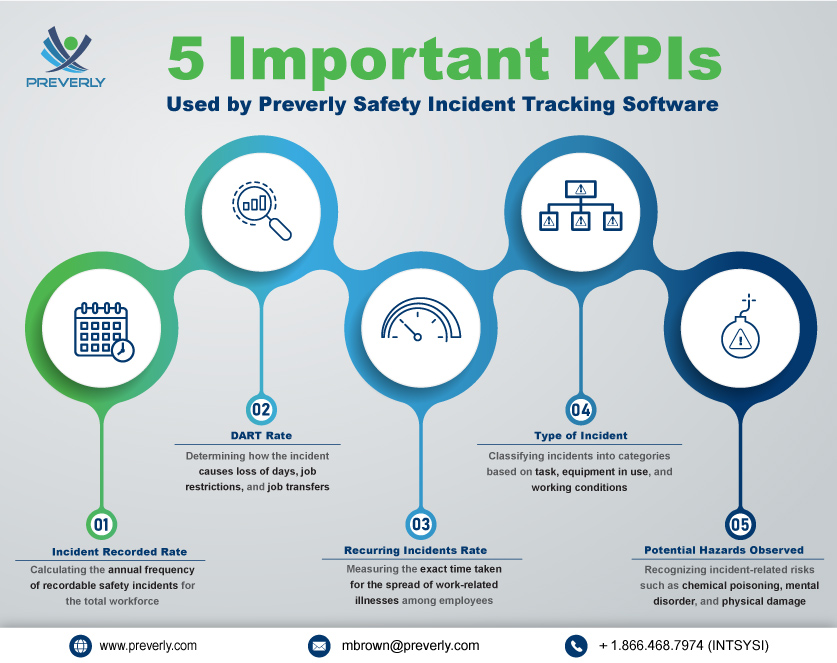
Preverly safety incident tracking software uses these five essential KPIs to determine the success of an organization’s safety policies & practices.
1. Incidents Recorded Rate
Incidents recorded rate is the value that provides the average recordable incidents a workforce experiences in a year. With the help of incidents record rate, the incident tracking software can generate reports on the recordable incidents to determine if they are increasing or decreasing. Consequently, safety managers can assess this data to improve their efforts and update their safety plans. Monitoring incidents with this KPI defines the goal for reducing the recordable incidents every year.
According to the industry standards, a specific formula determines the value of this KPI. To calculate the incidents recorded rate, the incident tracking software uses:
- Total number of employees in the organization
- Total number of active employees working in a year
- Total number of working hours in a year
- Total number of incidents recorded in a year
Let’s say, there are 100 employees working at the organization. As per the standard working conditions, each employee must work for 40 hours a week. In a year, there are 50 weeks, which brings the total number of working hours per employee to 2,000. Now, the Preverly incident tracking software multiplies this number with 100 and records the total number of working hours in a year as 200,000.
Then, the incident tracking software needs the number of total active employees working in the year. Let’s consider, 65 employees out of the 100 employees are working actively every year. Now, as per the previous calculation, the software calculates the total working hours of these 65 employees as 130,000 (65 employees X 40 hours X 50 weeks).
Lastly, the incident tracking software uses the total number of safety incidents recorded. For this example, let’s assume the organization’s workforce experiences 32 safety incidents at work in the entire year. Now, the software calculates the incidents recorded rate by multiplying 32 with 200,000 and dividing that by 130,000. Therefore, the incident tracking software records the incidents record rate for the said example as 49.23.
This means that out of the 100 employees in the organization, 49 are likely to experience a recordable incident in the year. According to the Bureau of Labor Statistics, the ideal incidents recorded rate should be not more than 2.9 for every 100 active employees. As a result, safety managers and employees realize how high this rate is and to what extent it needs to be lowered.
2. DART – Days Away, Restricted or Transferred
For detailed reports, safety incident management software uses dynamic KPIs that generate comprehensive value. One such multilateral KPI used by Preverly safety incident tracking software is the DART rate. The term “DART” is an acronym for “Days Away, Restricted or Transferred”. It is made up of three different KPIs, namely:
- Days Away Rate
- Job Restricted Rate
- Job Transferred Rate
Together, this DART rate is the value that determines the status of an organization in terms of the compensations spent on workplace injuries and occupational illnesses. The incident tracking software calculates this KPI as follows:
- Days Away Rate – This is also called the Lost Workday Rate (LWR). The incident tracking software uses standardized metric (days) to measure the LWR by calculating the total number of working days lost due to the incident. As per industry standards, an acceptable Days Away rate for 100 full-time employees should be less than five working days in a year.
- Job Restricted Rate – The incident tracking software calculates this rate by determining how many days was a certain job or occupational activity restricted due to the incident. Some severe illnesses may restrict the job for months while minor incidents can resume the workflow within days. Hence, this rate helps in calculating the impact of the incident on the organization’s workflow.
- Job Transferred Rate – To calculate this KPI, the incident tracking software monitors the days lost in transferring the job to a different employee, team, or department. When the incident causes fatalities, the job gets transferred to other employees. In this process, the organization loses valuable time. This time is monitored by the incident tracking software as the Job Transferred rate.
In simple terms, DART rate determines the loss of working days caused by the incident. Later, this value determines the time taken by the organization to resume its workflow post-incident.
While calculating the DART rate, Preverly incident tracking software considers restricted work as the total days the employee is barred from performing the routine functions after the incident. In several cases, the incident tracking software also adjusts this DART rate based on the medical data provided by a licensed healthcare physician on the number of days the employee will be unable to perform the routine activities of his or her job.
A high DART rate is a big red flag for the financial health of an organization. It means that the organization has suffered a financial loss for every day lost due to the incident. Therefore, Preverly provides an accurate DART rate so that the organization is able to analyze these losses properly.
Furthermore, the incident tracking software helps safety managers in sharing this DART rate information to the other employees, encouraging them to increase their working capacities in order to reduce costs and recover from this loss.
3. Recurring Incidents Rate
Being an advanced safety incident tracking software, Preverly is equipped with the latest workplace safety analytics. It uses an undervalued yet important KPI called the Recurring Incidents rate. This KPI is the value that determines the rate of incidence recurring. This rate is calculated by the incident tracking software by measuring the person-time, which is the time of occurrence of a work-related illness in an employee.
For example, a chemicals manufacturing industry records an incident that caused an employee to fall ill due to spillage or faulty equipment. The safety manager of this factory can use the incident tracking software to record the person-time information on how quickly the illness occurred in the employee. Consequently, the safety manager can also record the person-time for other employees who may have been exposed to the same illness. Based on this data, the incident tracking software can determine the time taken for the illness to recur among the workforce.
With this KPI data, Preverly helps safety managers in preventing the spread of illnesses in time by restricting access to infected/affected sections of the workplace and providing additional personal safety equipment to the employees.
4. Type of Incident (Incident Category)
One of the most important KPIs for tracking incidents is categorization. It is important to classify the type of incident while recording multiple incidents throughout the year. Preverly incident tracking software expands this KPI based on multiple factors, such as:
- Nature of task or job
- Materials and equipment used in the job
- Environment and working conditions at the time of incident
- Personnel involved in the incident
- Management practices resolving the incident
While calculating this KPI, it is important to select the category based on the factor that caused the incident. The incident tracking software needs to be updated with highly accurate data for this KPI measurement. Any wrong labeling can create misinformation while reporting incidents with the software. Therefore, Preverly ensures that the safety managers have enough flexibility to select a category or create a new category for incidents. On top of that, the incident tracking software also makes sure that each category is unique and does not overlap any other category.
5. Potential Hazards Observed
While tracking incidents, it is necessary to monitor every potential hazard observed during the process. A KPI called Potential Hazards Observed is used to determine the potential damage and the adverse impact of the incident. It is the value that tells the degree of harm that may be caused by the incident on the health of the workforce. Preverly incident tracking software allows safety managers to use this KPI for in-depth and insightful analysis of incidents.
Some common hazards listed under this KPI are:
- Asbestos poisoning
- Exposure to solvents
- Tetanus infection
- Extreme burning (heat)
- Radiation
- Carpal tunnel syndrome
- Back injuries
- Stress
By using this KPI, Preverly helps in generating more detailed incident reports. The incident tracking software also helps in recording data on the health effects of unknown illnesses. In addition to this, it also records the damage caused by the incident to the organization’s property and working environment.
KPI-based Incident Tracking with Preverly
The five KPIs explained above are the key components of safety management system software. Preverly leverages the power of these KPIs while assessing risks and reporting incidents at the workplace. The Preverly safety incident management software helps you become a resourceful safety manager. It is the best incident management software to protect employee health with detailed analysis. At the end of the day, these KPIs and their values will determine the success of safety management software in preventing illnesses and injuries at work.
Are you properly tracking your workplace safety incidents based on these KPIs? If not, you must experience how Preverly’s KPI-based incident tracking works by contacting us at mbrown@preverly.com